Haryana State Board HBSE 8th Class Maths Solutions Chapter 5 Data Handling InText Questions and Answers.
Haryana Board 8th Class Maths Solutions Chapter 5 Data Handling InText Questions
Think, Discuss and Write (Page 71)
Question 1.
If we change the position of any of the bars of a bar graph, would it change the information being conveyed? Why?
Answer:
Yes, It would change the information being conveyed because bar represents information for particular year, subject etc. If you change or shift the position of bar it would convey different meaning.
Try These (Page 71)
Question 1.
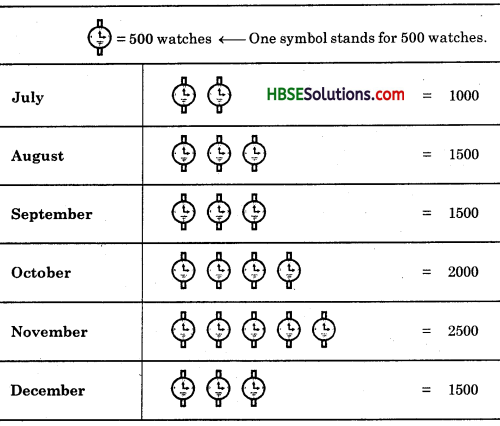
Draw an appropriate graph to represent the given information :
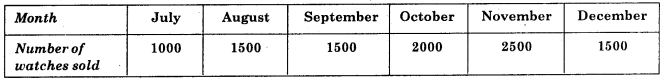
Solution:
A Pictograph :
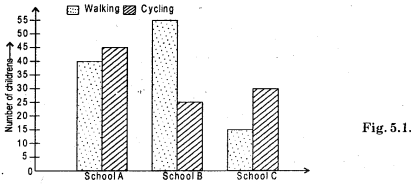
Question 2.
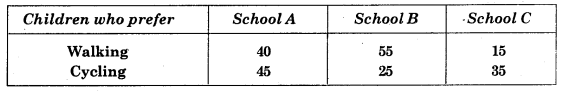
Solution:
Double bar graph
![]()
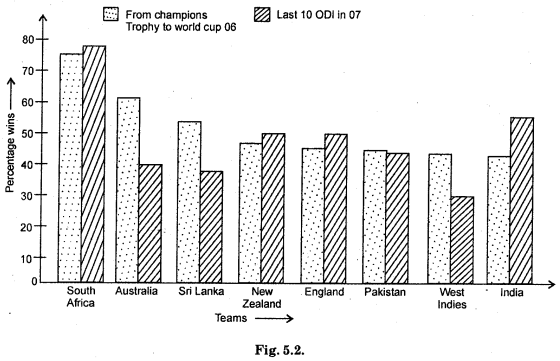
Question 3.
Percentage wins in ODI by 8 top cricket teams :
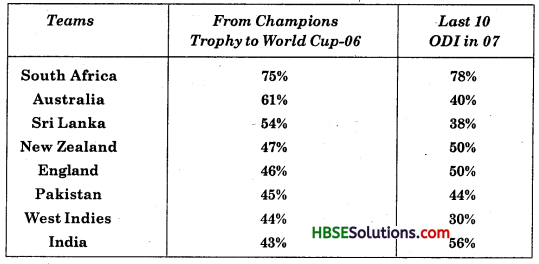
Solution:
Double bar graph :
Try These (Page 72)
Question 1.
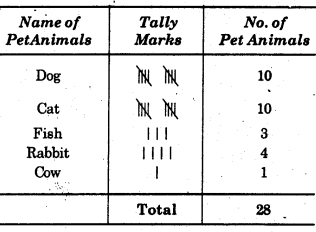
A group of Students were asked to say which animal they would like most to have as a pet. The results are given below :
dog, cat, cat, fish, cat, rabbit, dog, cat, rabbit, dog, cat, dog, dog, dog, cat, cow, fish, rabbit, dog, cat, dog, cat, cat, dog, rabbit, cat, fish, dog.
Make a frequency distribution table for the same.
Solution:
Try These (Page 73)
Question 1.
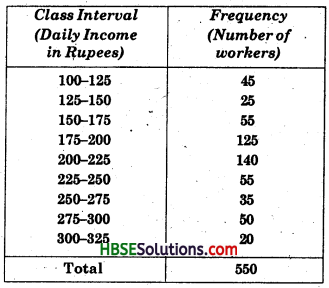
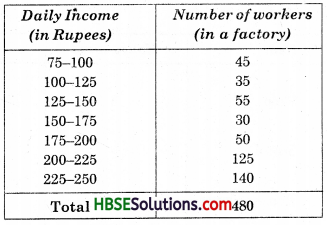
Study the following frequency distribution table and answer the questions given below:
Frequency Distribution of Daily Income of 550 workers of a factory
(i) What is the size of the class intervals ?
(ii) Which class has the highest frequency ?
(iii) Which class has the lowest frequency ?
(iv) What is the upper limit of the class interval 250-275 ?
(v) Which two classes have the same frequency ?
Solution:
(i) Size of the class intervals = 25
(ii) 200—225.
(iii) 300—325
(iv) 275
(v) 150—175 and 225 250.
![]()
Question 2.
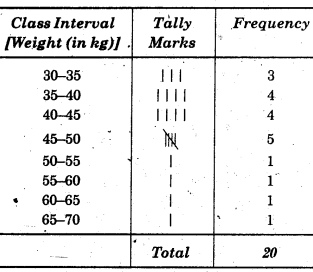
Construct a frequency distribution table for the data on weights (in kg) of 20 students of a class using intervals 30—35, 36—40 and so on.
40, 38, 33, 48, 60, 53, 31, 46, 34, 36, 49, 41, 55, 49, 65, 42, 44, 47, 38, 39.
Solution:
Try These (Page 75-76)
Question 1.
Observe the histogram (Fig. 5.3) and answer the questions given below :
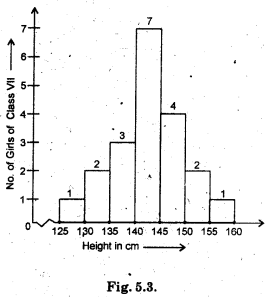
(i) What information is being given by the histogram ?
(ii) Which group contains maximum girls ?
(iii) How many girls have a height of 145 cms and more ?
(iv) If we divide-ihe girls into the following three categories, how many would there be in each?
150 cm and more — Group A
140 cm to less than 150 cm—Group B
Less than 140 cm — Group C
Solution:
(i) Height (in cm) of number of girls of class VII.
(ii) (140 – 145) contains maximum girls.
(iii) No. of girls have height 145 cms and more = 4 + 2 + 1 = 7.
(iv) 150 cm and more —Group A —3 girls 140 cm to less than 150—Group B—11 girls Less than 140 cm—Group C —6 girls.
Try These (Page 78)
Question 1.
Each of the following pie charts (Fig. 5.7) gives you a different piece of information about your class. Find the fraction of the circle representing each of these Information.
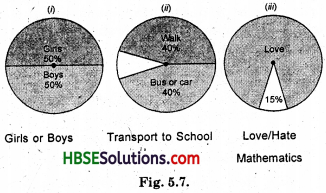
Solution:
(i) (a) The proportion of sector for girls
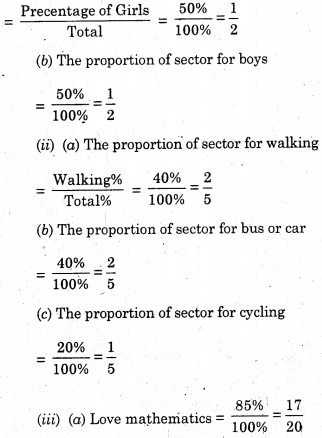
(b) Love Hindi = \(\frac{15 \%}{100 \%}\) = \(\frac{3}{20}\)
![]()
Question 2.
Answer the following questions based on the pie chart given (Fig. 5.8).
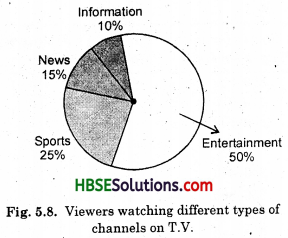
(i) Which type of programmes are viewed the most ?
(ii) Which two types of programmes have number of viewers equal to those watching sports channels ?
Solution:
(i) Entertainment.
(ii) (News and Information Channels together have equal number of viewers to those watching sports channels.
Try These (Page 81)
Question 1.
Draw a pie chart of the data given below.
The time spent by a child during a day.
Sleep—8 hours
School—6 hours
Homework—4 hours
Play—4 hours
Others—2 hours
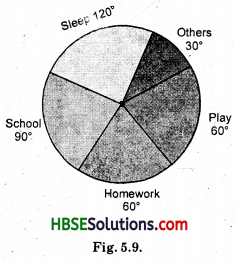
Solution:
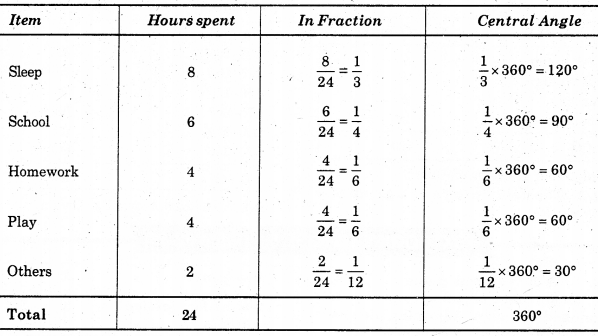
Now, we make the pie chart as under :
Think, Discuss and Write (Page 81)
Which form of graph would be appropriate to display the following data ?
Question 1.
Production of food grains of a state.
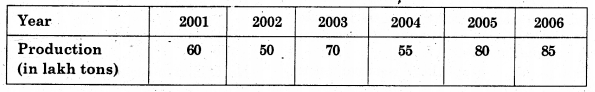
Solution:
A bar graph or pie chart.
![]()
Question 2.
Choice of food for a group of people.
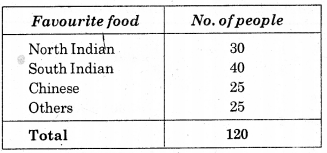
Solution:
A bar graph or pie chart.
Question 3.
The daily income of a group of a factory workers.
Solution:
A Histogram or a Bar Graph.
Try These (Page 83-84)
Question 1.
If you try to start a scooter, what are the possible outcomes ?
Answer:
Possible outcomes are either a scooter will start or do not start.
![]()
Question 2.
When a die is thrown, what are the six possible outcomes ?
Answer:
Six possible outcomesare 1, 2, 3, 4, 5 or 6.
Question 3.
When you spin the wheel shown, what are the possible out-comes ? (Fig. 5.15) List them.
(Outcome here means the sector at which the pointer stops).
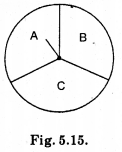
Answer:
Possible outcomes are pointer will stop at A, B or C.
Question 4.
You have a bag with five identical balls of different colours and you are to puli out (draw) a ball without looking at it; list the outcomes you would get (Fig. 5.16).

Answer:
Possible outcomes are : Red ball, White ball, Blue ball, Green ball or Yellow ball.
So, five outcomes are possible,
![]()
Think, Discuss and Write (Page 84)
Question 1.
In throwing a die :
(i) Does the first player have a greater chance of getting a six ?
(ii) Would the player who played after him have a lesser chance of getting a six ?
(iii) Suppose the second player got a six. Does it mean that the third player would not have a chance of getting a six ?
Solution:
(i) No,
(ii) No and
(iii) No.
Reason : You cannot control the result.
Throwing a die is random experiment.
Try These (Page 86)
Question 1.
Suppose you spin the wheel:
(i) List the number of outcomes of getting a green sector and not getting a green sector on this wheel (Fig. 5.17).
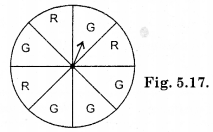
(ii) Find, the probability of getting a green sector.
(iii) Find the probability of not getting a green sector.
Solution:
(i) Total number of outcomes = 8
Number of outcomes of getting a green sector = 5 (Green sectors).
Number of outcomes of do not getting a green sector = 3 (Red sectors).
(ii) Probability of getting a green sector = \(\frac{Number of outcomes that make the event}{Total number of outcomes of the experiment}\)
= \(\frac{5}{8}\)
(iii) Probability of not getting a green sector = \(\frac{5}{8}\)