Haryana State Board HBSE 8th Class Maths Solutions Chapter 15 Introduction to Graphs Ex 15.1 Textbook Exercise Questions and Answers.
Haryana Board 8th Class Maths Solutions Chapter 15 Introduction to Graphs Exercise 15.1
Question 1.
The following graph shows the temperature of a patient in a hospital, recorded every hour.
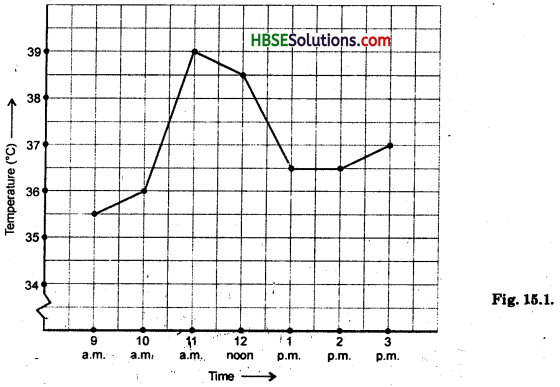
(a) What was the patient’s temperature at 1 p.m. ?
(b) When was the patient’s temperature 38.5°C ?
(c) The patient’s temperature was the same two times during the period given. What were these two times ?
(d) What was the temperature at 1.30 p.m. ? How did you arrive at your answer ?
(e) During which periods did the patients temperature showed an upward trend ?
Solution:
(a) The Patient’s temperature at 1 p.m. was 36.5°C.
(b) 12 noon.
(c) 1 p.m. and 2 p.m.
(d) The temperature at 1.30 p.m. was 36.5°. We observe the graph and finds that one fine indicates 30 minutes. So, taking a fine after 1 p.m. on X-axis move upward parallel to Y-axis where the line intersect the given line graph. It is obviously 36.5°C.
(e) 9 a.m. to 11 a.m.
Question 2.
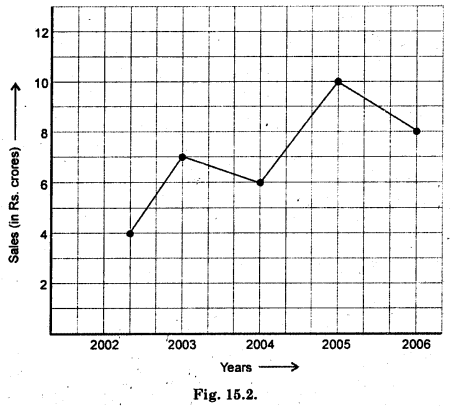
The following line graph shows the yearly sales figures for a manufacturing company.
(a) What were the sales in (i) 2002 (ii) 2006 ?
(b) What were the sales in (i) 2003 (ii) 2005 ?
(c) Compute the difference between the sales in 2002 and 2006.
(d) In which year was there the greatest difference between the sales as compared to its previous year ?
Solution:
(a) (i) Sales in 2002 = 4 crores
(ii) Sales, in 2006 = 8 crores
(b) (i) Sales in 2003 = 7 crores
(ii) Sales in 2005 = 10 crores
(c) The difference between the sales in 2002 and 2006 = 8 – 4 = 4 crores.
(d) The greatest difference between the sales as compared to its previous year in 2004 – 2005.
![]()
Question 3.
For an experiment in Botany, two different plants, plant A and plant B were grown under similar laboratory conditions. Their heights were measured at the end of each week for 3 weeks. The results are shown by the following graph.
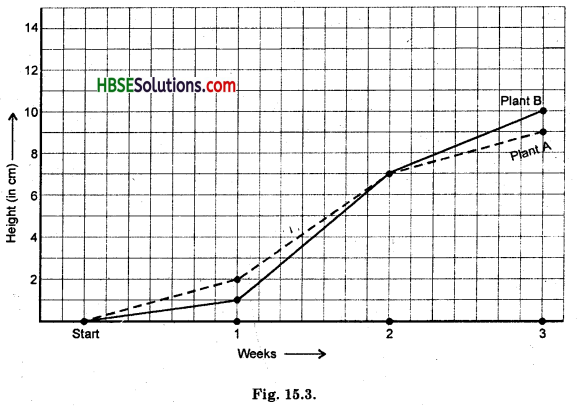
(a) How high was Plant A after (i) 2 weeks (ii) 3 weeks ?
(b) How high was Plant B after (i) 2 weeks (ii) 3 weeks ?
(c) How much did Plant A grow during the 3rd week ?
(d) How much did Plant B grow from the end of the 2nd week to the end of the 3rd week ?
(e) During which week did Plant A grow most ?
(f) During which week did Plant B grow least ?
(g) Were the two plants of the same height during any week shown here ? Specify.
Solution:
(a) (i) Height of Plant A after 2 weeks = 7 cm
(ii) Height of Plant A after 3 weeks = 9 cm
(b) (i) Height of Plant B after 2 weeks = 7 cm
(ii) Height of Plant B after 3 weeks = 10 cm
(c) The Plant A grows during the 3rd week = 9 – 7 = 2 cm.
(d) The Plant B grows from the end of the 2nd week to the end of the 3rd week
= 10 cm – 7 cm = 3 cm.
(e) 2nd week.
(f) First week.
(g) Yes, the two plants have same height in the end of 2nd week.
Question 4.
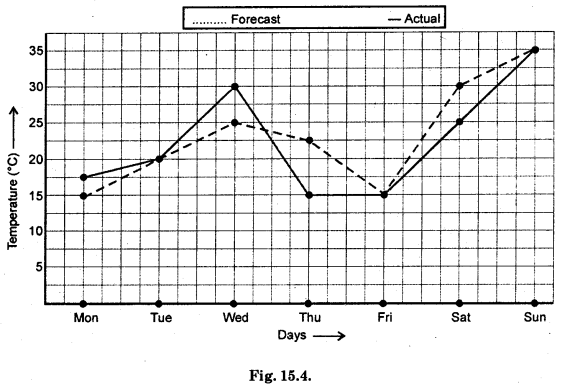
The following graph shows the temperature forecast and the actual temperature for each day of a week.
(a) On which days was the forecast temperature the same as the actual temperature ?
(b) What was the maximum forecast temperature during the week ?
(c) What was the minimum actual temperature during the week ?
(d) On which day did the actual temperature differ the most from the forecast temperature ?
Solution:
(a) Tuesday, Friday and Sunday.
(b) Sunday (35°C).
(c) 15°C.
(d) Thursday = 22.5°C – 15°C = 7.5°C.
![]()
Question 5.
Use the tables below to draw linear graphs :
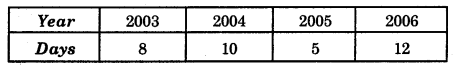
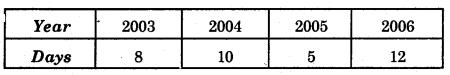
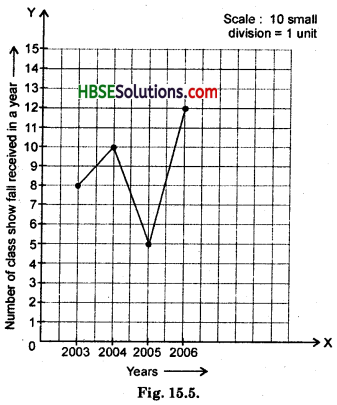
(a) The number of days a hill side city received snow in different years.
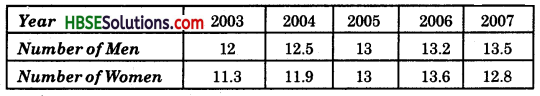
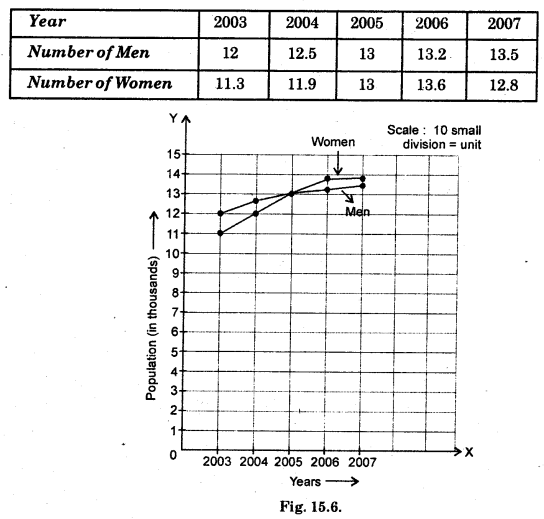
(b) Population (in thousands) of men and women in a village in different years.
Solution:
(a) Show fall received in different days during the years in a hill side city.
(b) Population in village (in thousands)
Question 6.
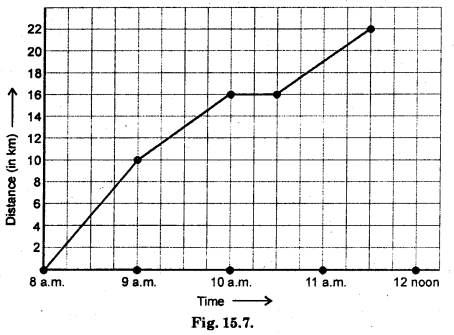
A courier-person cycles from a town to a neighbouring suburban area to deliver a parcel to a merchant. His distance from the town at different times is shown by the following graph :
(a) What is the scale taken for the time axis ?
(b) How much time did the person take for the travel ?
(c) How far is the place of the merchant from the town ?
(d) Did the person stop on his way ? Explain.
(e) During which period did he ride fastest ?
Solution:
(a) 4 small division = 1 hour
Let the 4 small division = 1 cm
∴ 1 cm = 1 hour
(b) 3 hour 30 minutes or 3.30 hour
(c) 22 km
(d) Yes, he stops between 10 a.m. to 10.30 a.m. because the distance is not changing with the change in time. In other words, we can say that the person is at rest. Hence, if a body remains at rest the graph of its motion is a straight line parallel to time-axis i.e. x-axis.
(e) Between 8 a.m. to 9 a.m.
![]()
Question 7.
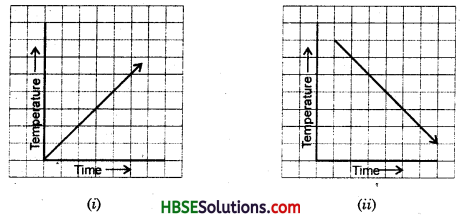
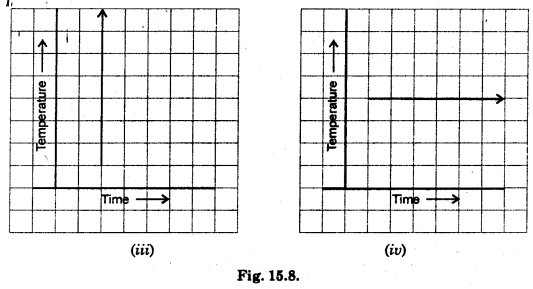
Can there be a time-temperature graph as follows ? Justify your answer.
Solution:
(i) Yes, it may be a time-temperature graph because with change in time temperature may increase for example, during day time in summer.
(ii) Yes, it may be possible that with change in time temperature may fall uniformaly. For example, during night in winter.
(iii) No, it can not be a time-temperature graph. Here, temperature is changing without any change of time, which is impossible.
(iv) No, temperature cannot be constant with change in time. However, it may be possible for a short span of time.