Haryana State Board HBSE 8th Class Maths Solutions Chapter 5 Data Handling Ex 5.1 Textbook Exercise Questions and Answers.
Haryana Board 8th Class Maths Solutions Chapter 5 Data Handling Exercise 5.1
Question 1.
For which of these would you use a histogram to show the data ?
(a) The number of letters for different areas in a postman’s bag.
(b) The height of competitors in an athletics meet.
(c) The number of cassettes produced by 5 companies.
(d) The number of passenger boarding trains from 7:00 am to 7:00 pm at a station.
Give reasons for each.
Solution:
(a) Different areas A, B, C has a certain number of letters. So, there is no class interval exist. Thus, it is better to represent the data by a bar graph than by a histogram.
(b) Height of competitors lies between a certain range. So, class interval exist.
Therefore, we use a histogram to represent the data.
(c) There is no class interval. There is a name of five companies. So, we cant show the data by a histogram.
(d) Class intervals like 7 am – 9 am, 9 am – 11 am etc. are necessary to show the number of passengers boarding to trains during that time intervals.
So, a histogram is suitable representation of data.
Question 2.
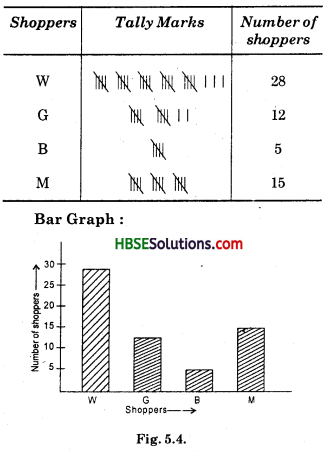
The shoppers who come to a departmental store are marked as : man (M), woman (W), boy (B) or girl (G). The following list gives the shoppers who came during the first hour in the morning :
WWWGBWWMGGMMWWWWG B MWB GGMWWMMWWWMWBWG MWWWWGWMMWWMWGWMGW M M B G G W.
Make a frequency distribution table using tally marks. Draw a bar graph to illustrate it.
Solution:
Frequency Distribution Table :
![]()
Question 3.
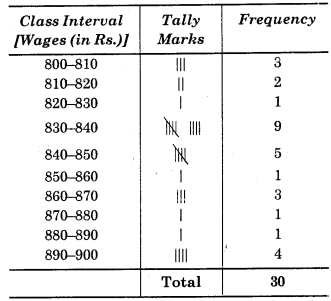
The weekly wages (in Rs.) of 30 workers in a factory are:
830, 835, 890, 810, 835, 836, 869, 845, 898, 890, 820, 860, 832, 833, 855, 845, 804, 808, 812, 840, 885, 835, 835, 836, 878, 840, 868, 890, 806, 840.
Using tally marks make a frequency table with intervals as 800-810, 810-820 and so on.
Solution:
Question 4.
Draw a histogram for the frequency table made for the data in Question 3, and answer the following questions :
(i) Which group has the maximum number of workers ?
(ii) How many workers earn Rs. 850 and more ?
(iii) How many workers earn less than Rs. 850?
Solution:
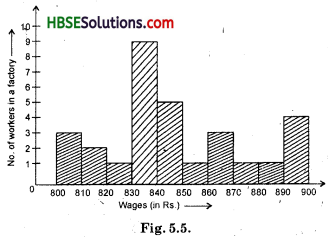
(i) Group (830—840) has maximum number of workers.
(ii) No. of workers whose earning Rs. 850 and more = 1 + 3 + 1 + 1 + 4=10
(iii) No. of workers whose earning is less than 850 = 3 + 2 + 1 + 9 + 5 = 20.
![]()
Question 5.
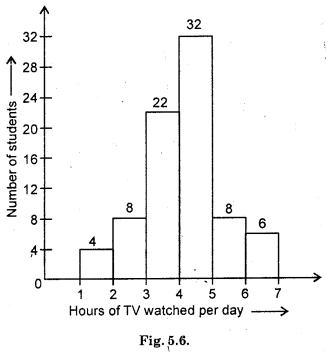
The number of hours for which students of a particular class watched television during holidays is shown through the given graph.
Answer the following:
(i) For how many hours did the maximum number of students watch TV ?
(ii) How many students watched TV for less than 4 hours ?
(iii) How many students spent more than 5 hours in watching TV ?
Solution:
(i) Maximum number of students watched TV = (4 – 5) hours.
(ii) No. of students watched TV less than 4 hours = 4 + 8 + 32 = 44 hours.
(iii) Students spent more than 5 hours in watching TV = 8 + 6 = 14 hours.