Haryana State Board HBSE 8th Class Maths Solutions Chapter 15 Introduction to Graphs InText Questions and Answers.
Haryana Board 8th Class Maths Solutions Chapter 15 Introduction to Graphs InText Questions
Try These (Page 244)
Question 1.
The following table gives the quantity of petrol and its cost:
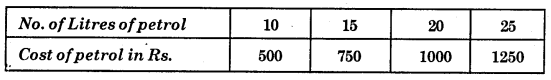
Plot a graph to show the data.
Also, use the graph to find how much petrol can be purchased for Rs. 800.
Solution:
(i) Let us take a suitable scale on both the axes (Fig. 15.14).
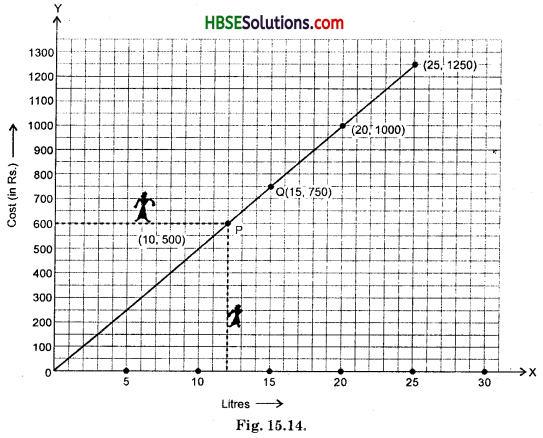
(ii) Mark number of litres along the horizontal axis.
(iii) Mark cost of petrol along the vertical axis.
(iv) Plot the points : (10, 500), (15, 750), (20, 1000), (25, 1250).
(v) Join the points.
If we observe that graph and drop perpendiculars from 800. The point is Q. We draw perpendicular from this point on X-axis. The required value is 16 litre.
![]()
Try These (Page 245)
Question 1.
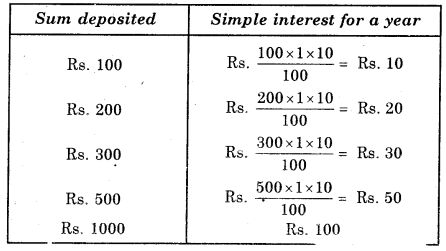
A bank gives 10% Simple Interest (S.I.) on deposits by senior citizens. Draw a graph to illustrate the relation between the sum deposited and simple interest earned. Find from your graph
(a) the annual interest obtainable for an investment of Rs. 250.
(b) the investment one has to make to get an annual simple interest of Rs. 70.
Is this, a case of direct variation ? Justify your answer.
Solution:
Steps to follow :
1. Find the quantities to be plotted as Deposit and S.I.
2. Decide the quantities to be taken on x-axis and on y-axis.
3. Choose a scale.
4. Plot points.
5. Join the points.
We get a table of values
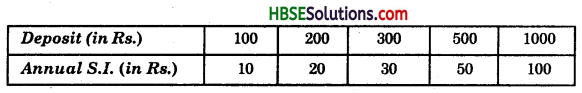
(i) Scale : 1 unit = Rs. 100 on horizontal axis; 1 unit = Rs. 10 on vertical axis.
(ii) Mark Deposits along horizontal axis.
(iii) Mark Simple Interest along vertical axis.
(iv) Plot the points : (100, 10), (200, 20), (300, 30), (500, 50) etc.
(v) Join the points. We get a graph that is a line (Fig 15.15).
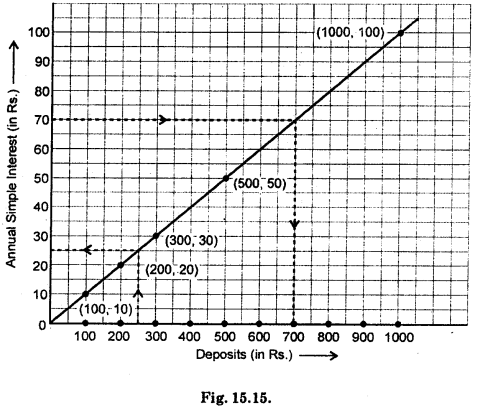
(a) Corresponding to Rs. 250 on horizontal axis, we get the interest to be Rs. 25 on the vertical axis.
(b) Corresponding to Rs. 70 on the vertical axis, we get the sum to be Rs. 700 on the horizontal axis.
Yes, this is a case of direct variation. More you deposit more you earn interest. Also, the graph is a straight line which indicates that the two quantities Simple Interest and amount deposited are in direct variation.