Haryana State Board HBSE 6th Class Maths Solutions Chapter 9 Data Handling Ex 9.4 Textbook Exercise Questions and Answers.
Haryana Board 6th Class Maths Solutions Chapter 9 Data Handling Exercise 9.4
Question 1.
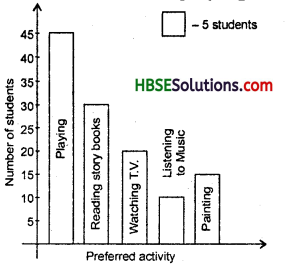
A survey of 120 school students was done to find which activity they prefer to do in their free time. Draw a bar graph to illustrate the given data taking scale of 1 unit length = 5 students.
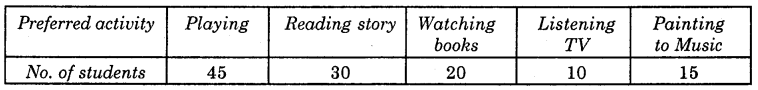
Which activity is preferred by most of the students other than playing ?
Solution:
Reading books is preferred by most of the students other than playing.
![]()
Question 2.
Following table shows the number of bicycles manufactured in a factory during the years 1998 to 2002. Illustrate this data using a bar graph. Choose a scale of your choice.
Years — No. Manufactured of Bicycles
1998 — 800
1999 — 600
2000 — 900
2001 — 1100
2002 — 1200
(a) In which year were the maximum number of bicycles manufactured ?
(b) By looking at the bar graph, write which two years show the maximum rise in the manufacture of bicycles ?
Solution:
(a) In 2002, maximum number of bicycles were manufactured.
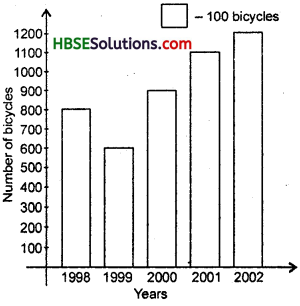
(b) 2000 and 2001 show the maximum rise in the manufacture of bicycles.
![]()
Question 3.
Number of persons in various age groups in a town is given in the following table :
Age group — No. of persons
1-14 — 2 lakh
15-29 — 1 lakh 60 thousand
30-44 — 1 lakh 20 thousand
45-59 — 1 lakh 20 thousand
60-74 — 80 thousand
75 and above — 40 thousand
Draw the bar graph to represent the above information and answer the following questions (take 1 unit length = 20 thousand)
(a) Which two age groups have the same population ?
(b) All persons in the age group of 60 and above are called senior citizens. How many senior citizens are there in the town ?
Solution:
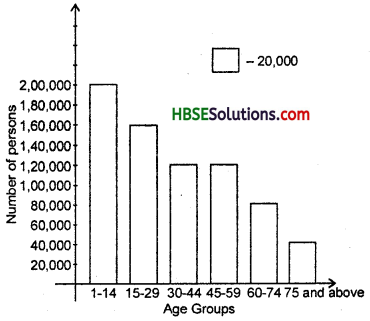
(а) 30-44 and 45-59 have the same population.
(b) .80,000 + 40,000 = 1,20,000 are senior citizens.