Haryana State Board HBSE 6th Class Maths Solutions Chapter 9 Data Handling Ex 9.3 Textbook Exercise Questions and Answers.
Haryana Board 6th Class Maths Solutions Chapter 9 Data Handling Exercise 9.3
Question 1.
Bar graph given below shows the amount of wheat purchased by government during the year 1998-2002.
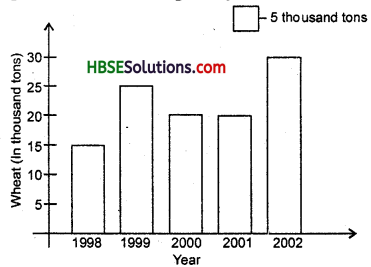
Read the bar graph andi write down your observations.
Solution:
Year — Amount of wheat purchased
1998 — 15 thousand tons
1999 — 25 thousand tons
2000 — 20 thousand tons
2001 — 20 thousand tons
2002 — 30 thousand tons
![]()
Question 2.
Observe this bar graph which is showing the sale of shirts in a ready¬made shop from Monday to Saturday. Now answer the following questions :
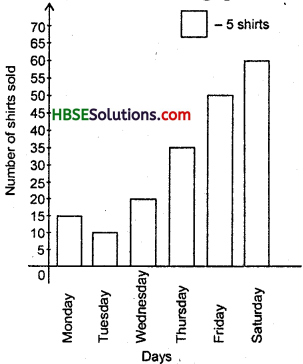
(a) What information is given by the above bar graph ?
(b) Mention the scale chosen on the vertical line representing the no. of shirts.
(c) Mention the day on which the maximum number of shirts were sold and also mention the number of shirts sold.
(d) Mention the day on which the minimum number of shirts were sold.
(e) How many shirts were sold on Thursday ?
Solution:
(a) This bar graph shows the number of shirts sold from Monday to Saturday.
(b) 1 unit = 5 shirts.
(c) The maximum no. of shirts 60 were sold on Saturday.
(d) The minimum no. of shirts were sold on Tuesday.
(e) On Thursday, 35 shirts were sold.
Question 3.
Observe this bar graph which is showing the marks obtained by Aziz in half-yearly examination in different subjects. Answer the questions given below :
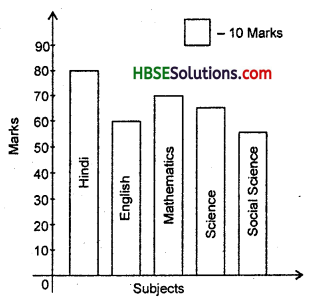
(a) What information is given by the bar graph ?
(b) Name the subject in which Aziz has scored maximum marks ?
(c) Name the subject in which he has scored minimum marks ?
(d) State the names of the subjects and marks obtained in each of them ?
Solution:
(a) This bar graph shows the marks obtained by Aziz in different subjects.
(b) Hindi (c) Social Studies
(d) Subjects — Marks obtained
(i) Hindi — 80
(ii) English — 60
(iii) Mathematics — 70
(iv) Science — 65
(v) Social Studies — 55
![]()
Question 4.
Following is a bar graph of circu¬lation of newspapers (dailies) in a town in six languages. Study the bar graph and answer the following questions :
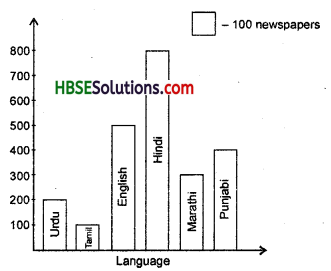
(a) Find the number of newspapers circulated in Hindi, Punjabi, Urdu, Marathi and Tamil.
(b) Name the language in which the least no. of newspapers are circulated.
(c) What is the difference between the no. of Hindi and English papers being read ?
(d) Write the no. of newspapers circulated in different languages in ascending order.
Solution:
(a) Hindi—800, Punjabi—400, Urdu—200, Marathi—300, Tamil—100.
(b) Least no. of newspapers are circulated in Tamil.
(c) Difference between Hindi and English papers = 800 -500 = 300.
(d) 100, 200, 300, 400, 500, 800.